App Dev · · 5 min read
Introducing NetLay, a living map of your network
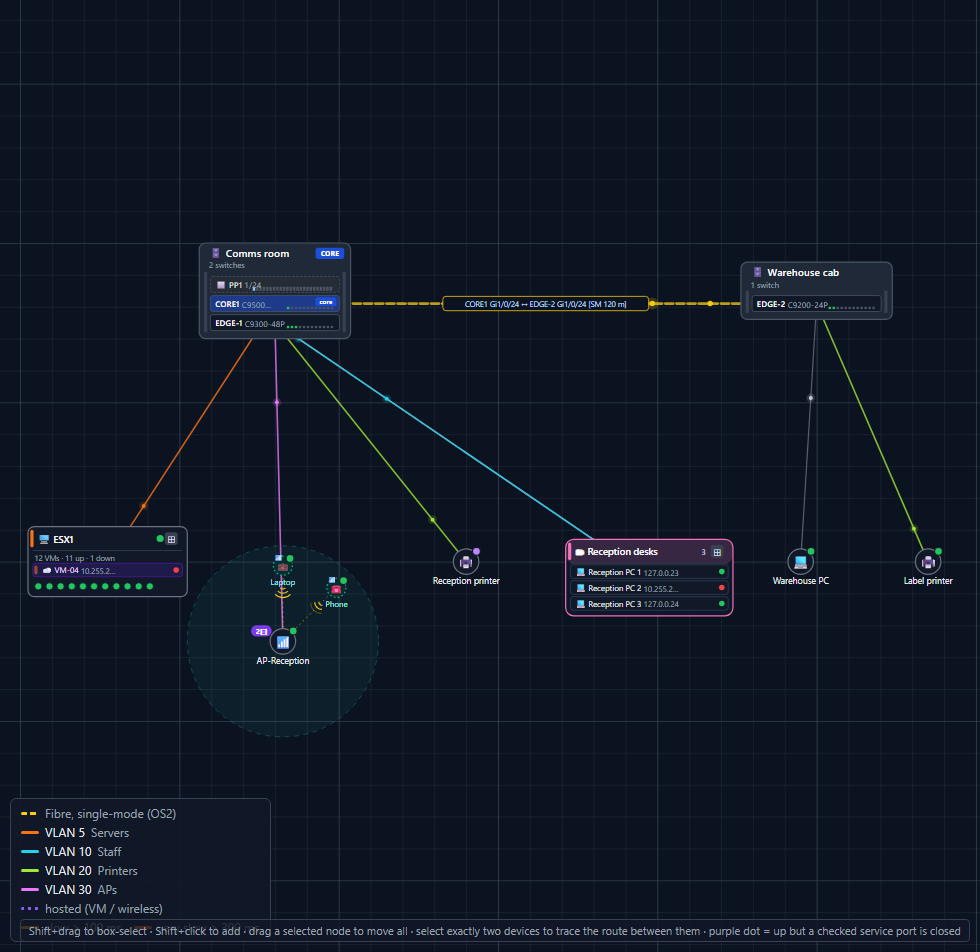
NetLay is a map of the building with every cabinet, switch, port and device on it, and a live dot beside each one telling you whether it is answering.
Which port is that thing on?#
Every small IT team has had this conversation. Something has stopped working, somebody asks which port it is plugged into, and the honest answer is that nobody knows. There is a Visio drawing somewhere that was accurate two years ago. There is a spreadsheet that says one thing and a switch that says another, and the only way to settle it is to walk to the comms room with a torch and start following cables.
The tools we have don't really help with that. Monitoring will tell you a device has stopped answering, which is useful, but it has no idea where that device physically is or what it hangs off. Documentation tools will give you a lovely picture, and the picture is dead the moment somebody moves a cable and forgets to update it.
So I have been building NetLay. It is a map of the building with the cabinets on it, the switches inside them, every port on those switches, every device plugged into those ports, and a live dot next to each one saying whether it is currently answering.
Three ideas.#
The whole thing comes down to three decisions I made early and have stuck to.
The first is that it should look like the building. The cabinets go where they actually are on the floor plan, the devices sit roughly where they physically live, and you can put the building's own plan behind it all as an image. I have spent years looking at logical diagrams that are technically correct and completely useless when you are stood in a corridor trying to work out which wall the network point is on.
The second is that ports are the source of truth. A device isn't plugged into a switch, it is plugged into Gi2/0/17, and the app treats that as the important part. It refuses to double book a port. It names ports the way the switch command line names them, which means the stack member number, the module and the port, and it knows about SFP network modules and stack cables. If your documentation says a device is on port 17 and the switch disagrees, one of them is lying and it is usually the documentation.
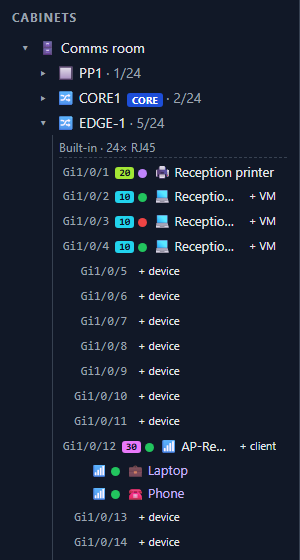
The third is that the picture should be alive. A background pinger works its way round every device on the map and the dots go green or red, the line dashes when something is down, and the round trip time appears when a link is being slow about it. There is a small travelling pulse along each cable as well, which does nothing useful at all and which I would not remove for any money, because a healthy network looks healthy at a glance and you know instantly when it doesn't.
Some things I am pleased with.#
The Cisco interface naming is the one I am most pleased with, which tells you something about my life. Stack member two's ports really are Gi2/0/x, the uplink module really is Te1/1/x, and I went and read the documentation rather than trusting my memory, because getting that wrong would annoy exactly the people I am building this for.
Virtual machines hang off their host on a dotted line, or fold up inside the server node when there are a dozen of them, and they keep their VLAN colour either way. A host with twelve VMs on it should not take over the whole map.
The whole application zips up into a portable folder with Python bundled inside it. Copy it to a laptop, double click, and it runs, with no installer and no admin rights. That started as a convenience for me and turned into the way I expect most people will actually try it.
Sharing was the last one. You can hand somebody a view only link to a building and they see the live status without being able to move a single thing, which is the version of the map I want on a wall screen or in the hands of somebody on the phone to a supplier.
What it is built with#
Short version for the curious. The back end is FastAPI with SQLite underneath it, the front end is React and TypeScript drawing plain SVG, and one process serves both so there is only ever one thing to start.
The pings go out through icmplib without needing administrator rights, and if that isn't available it falls back to shelling out to the operating system's own ping and reading the output. There is a good reason for that fallback and it is the subject of the next post.
I did think about building it in a game engine, since I am comfortable in one, and I talked myself out of it in about an hour. The map is the easy part. The forms, the port bookkeeping and the pinging are the actual work, and all three of those want a web stack.
What it doesn't do yet#
It pings from one machine, so it only knows about what that particular PC can reach. Remote probes for other sites are designed on paper and not built.
There is no discovery yet either, so at the moment you are typing your network in by hand. That is fine for one cabinet and tedious for ten, and it is high on the list.
It is a single server with a SQLite file behind it. That is fine for a team looking after their own buildings, and it is not a hosted service for other people's networks.
Who it is for#
Small and mid size IT teams who look after a few buildings' worth of switches. Engineers who have inherited a site nobody documented. Anybody who has drawn a rack in Visio and hated every minute of it.
It is not for a data centre with thousands of ports in a row, not yet anyway, and it is not a replacement for proper monitoring. If you want thresholds, graphs and someone being woken up at three in the morning, keep your existing tools and let this one tell you where things are.
This is the first post of a build diary. Next time, the first working build, and the afternoon I spent finding out that Windows ping lies to you.